NYC Yellow Taxi Data Project using Fabric
This project demonstrates a complete end-to-end data engineering and analytics solution implemented using Microsoft Fabric for NYC Yellow Taxi trip data (January– October 2025). The solution includes Lakehouse ingestion, Warehouse staging and presentation modeling, metadata-driven pipelines, SQL-based transformations, orchestration automation, and Power BI reporting.
Project Overview
This implementation reflects production-style data engineering practices. The objectives were to:
- Ingest monthly Parquet files into a Fabric Lakehouse
- Load raw data into a Warehouse staging layer
- Cleanse and validate incoming records
- Enrich trip data with taxi zone lookup data
- Transform and model data in a presentation layer
- Maintain full historical data (append model)
- Log per-run metadata for automation and auditability
- Automate the month-over-month processing workflow
- Expose data via a Fabric semantic model for Power BI reporting
The project was completed using Microsoft Fabric’s Data Factory, Lakehouse, Warehouse, Dataflows Gen2, SQL stored procedures, and Power BI.
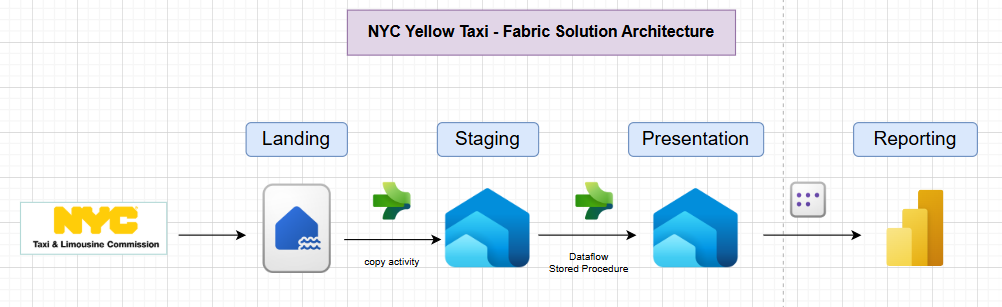
Fabric Solution Architecture
- A metadata table called
processing_logwill store information about the data processed. - Data in the staging layer will be deleted prior to any new data load.
- Data in the staging layer will be appended to presentation layer table.
1. Landing Layer
Data Dictionary for Yellow Taxi Trip Records
Created a new Workspace called NYCTaxiDataProject
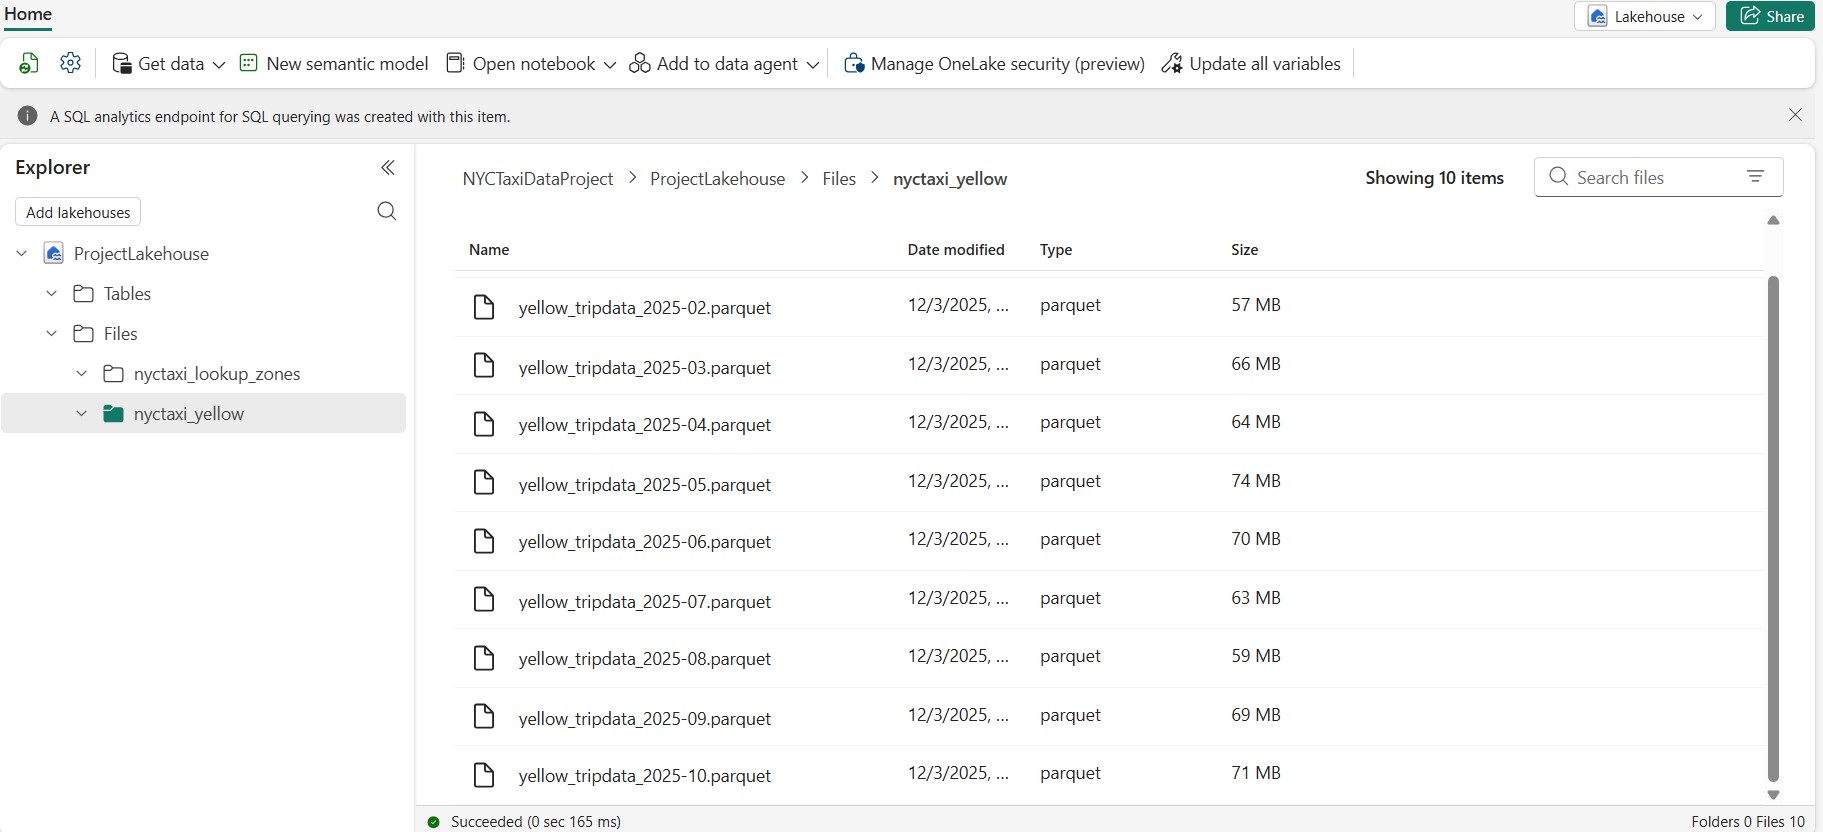
Inside this workspace, I have created a Lakehouse called ProjectLakehouse
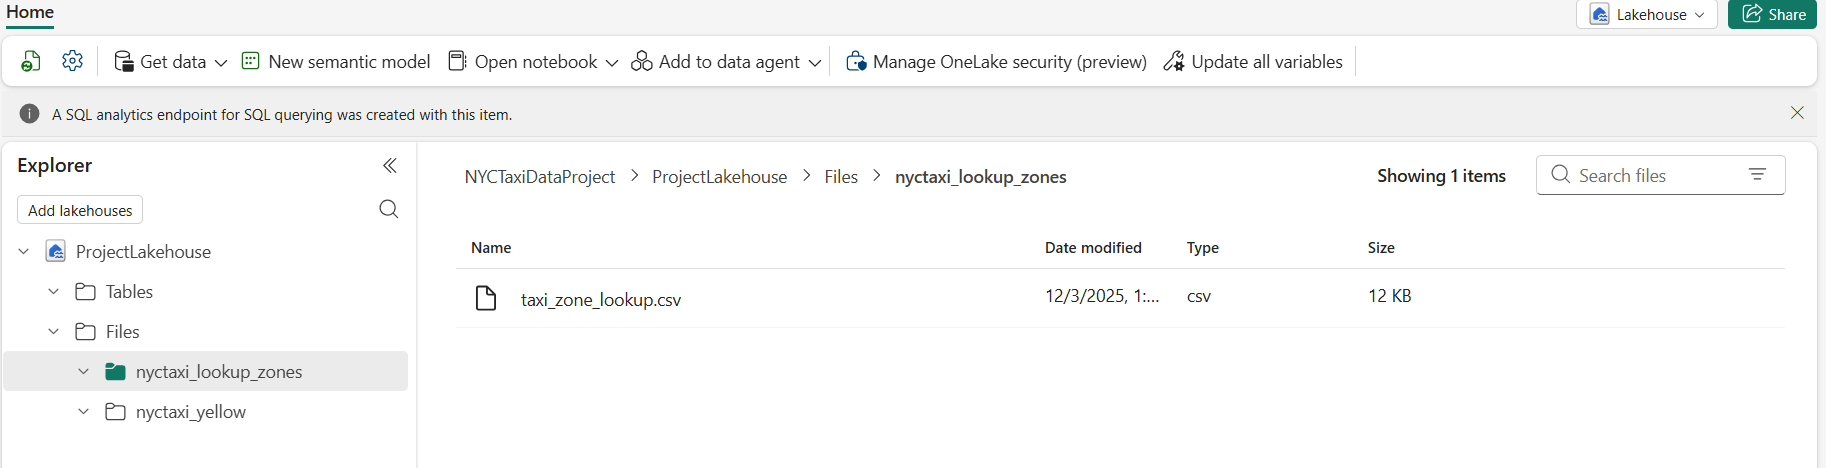
Each month data is available in Parquet files. I downloaded it into my local computer and uploaded to the Lakehouse as shown below. In the lakehouse, I have created 2 folders - one for the taxi monthly data, other for lookup zones to store the lookup zones csv file.
- NYC TLC Yellow Taxi Trip Data (Parquet)
Ten monthly Parquet files (January–October 2025), each containing 3–4 million rows, are uploaded into the folder nyctaxi_yellow
- Taxi Zone Lookup (CSV)
Maps LocationID to borough, zone, and service zone. The csv file is uploaded to the folder nyctaxi_lookup_zones as shown below.
2. Staging Layer
Created a Warehouse called ProjectWarehouse
Created a folder named NYC Taxi Data Pipelines to organize the data pipelines.
Pipeline 1: pl_stg_lookup
One-time pipeline to load taxi zone lookup data from Lakehouse into stg.taxi_zone_lookup table in the warehouse.
This pipeline includes a single copy data activity. Specify the Source as taxi_zone_lookup.csv file present in the Lakehouse as shown below.
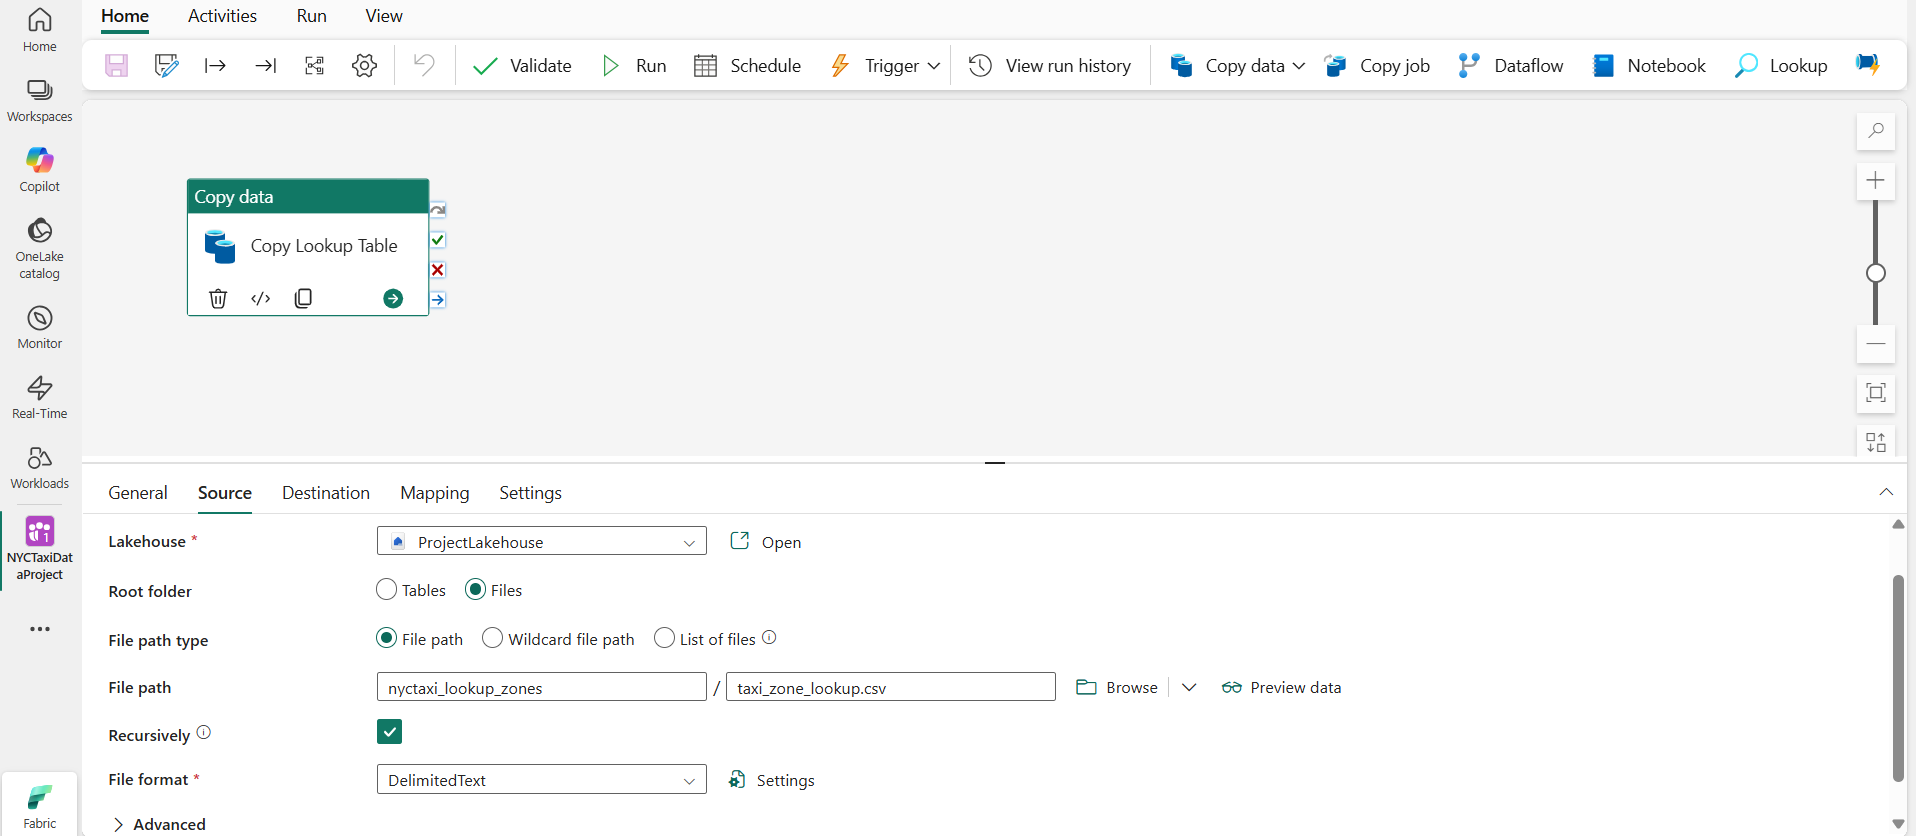
Destination will be the new table which will be auto created in the Warehouse as shown below.
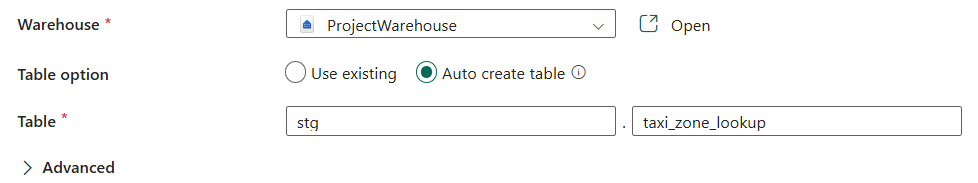
Once this pipeline run is complete, we will have the table taxi_zone_lookup created in the stg schema in the ProjectWarehouse.
Pipeline 2: pl_stg_processing_nyctaxi
The goal of this pipeline is to copy the data present in raw parquet files into a single table in the ProjectWarehouse so that we have clean data to use later in the presentation layer.
Initially, we start with Copy Data activity and we use an expression in the source file path so that we can process the files based on the month number in the file name.
Below is the expression used for file name:
1
@concat('yellow_tripdata_', variables('v_date'), '.parquet')
Make sure the file format is set to Parquet as the source files are in this format.
We also need to ensure Auto create table is selected in the Destination for the first run to create the destination table.
We need to set the variable v_date value to 2024-01 as the default value for our first pipeline run.
Once we run this pipeline, we can observe the new table created in the Warehouse, which is named as nyctaxi_yellow.
There are some records which are outside the current month (January) in the table, which can be observed by running below query:
1
2
3
4
SELECT
    max(tpep_pickup_datetime),
    min(tpep_pickup_datetime)
FROM stg.nyctaxi_yellow;
We have to create a stored procedure to remove the outliers using below SQL code.
1
2
3
4
5
6
CREATE PROCEDURE stg.data_cleaning_stg
@end_date DATETIME2,
@start_date DATETIME2
AS
DELETE FROM stg.nyctaxi_yellow
WHERE tpep_pickup_datetime < @start_date or tpep_pickup_datetime > @end_date;
We can now add the Stored Procedure Activity to the pipeline to automatically run after the copy data activity.
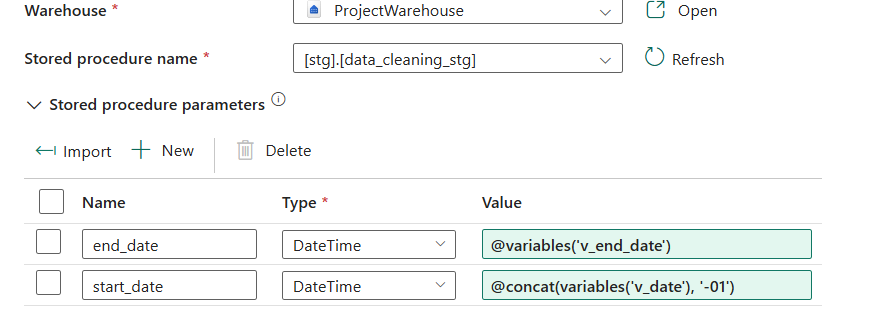
Create Set variable Activity to set the variable v_end_date using below expression:
1
@addToTime(concat(variables('v_date'), '-01'), 1, 'Month')
We can now set the start and end dates for the stored procedure as shown below:
We can now run the pipeline to implement the cleaning, but before that we need to these settings as shown:
We now create the metadata.processing_log table in the warehouse.
1
2
3
4
5
6
7
8
9
10
create schema metadata;

create table metadata.processing_log
(
    pipeline_run_id varchar(255),
    table_processed varchar(255),
    rows_processed INT,
    latest_processed_pickup datetime2(6),
    processed_datetime datetime2(6)
);
Now, in order to record the logs, we create a Stored Procedure which inserts data into the metadata.processing_log table whenever we process the monthly trips data.
1
2
3
4
5
6
7
8
9
10
11
12
13
CREATE PROCEDURE metadata.insert_staging_metadata
    @pipeline_run_id VARCHAR(255),
    @table_name VARCHAR(255),
    @processed_date DATETIME2
AS
    INSERT INTO metadata.processing_log (pipeline_run_id, table_processed, rows_processed, latest_processed_pickup, processed_datetime)
    SELECT
        @pipeline_run_id AS pipeline_id,
        @table_name AS table_processed,
        COUNT(*) AS rows_processed,
        MAX(tpep_pickup_datetime) AS latest_processed_pickup,
        @processed_date AS processed_datetime
    FROM stg.nyctaxi_yellow;
Connect the previous stored procedure which removes the outliers to new Stored Procedure activity called SP Loading Staging Metadata. Below are the variables we need to set for this SP.
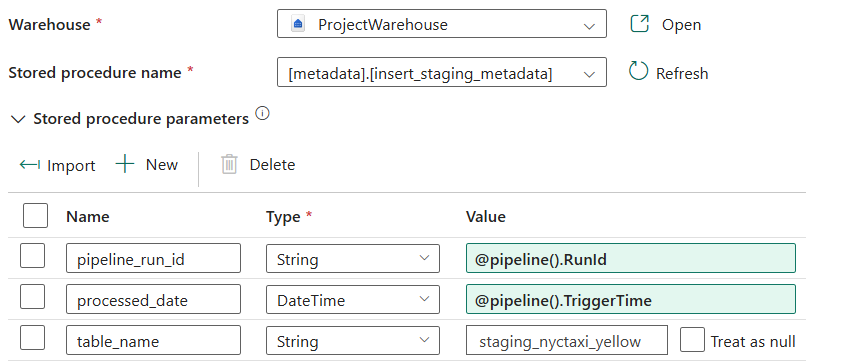
Remember thev_date set to “2024-01” hardcoded value. We need to update the pipeline to automatically set this variable to next month that needs to be processed.
To do this, we create a Script Activity called Latest Processed Data. In the settings of this activity, we need to enter below SQL query.
1
2
3
4
5
select top 1
latest_processed_pickup
from metadata.processing_log
where table_processed = 'staging_nyctaxi_yellow'
order by latest_processed_pickup desc;
This activity allows to get the last processed month. We can use this to create the Set variable Activity to set the value to v_date by adding 1 month to the output.
1
@formatDateTime(addToTime(activity('Latest Processed Data').output.resultSets[0].rows[0].latest_processed_pickup, 1, 'Month'), 'yyyy-MM')
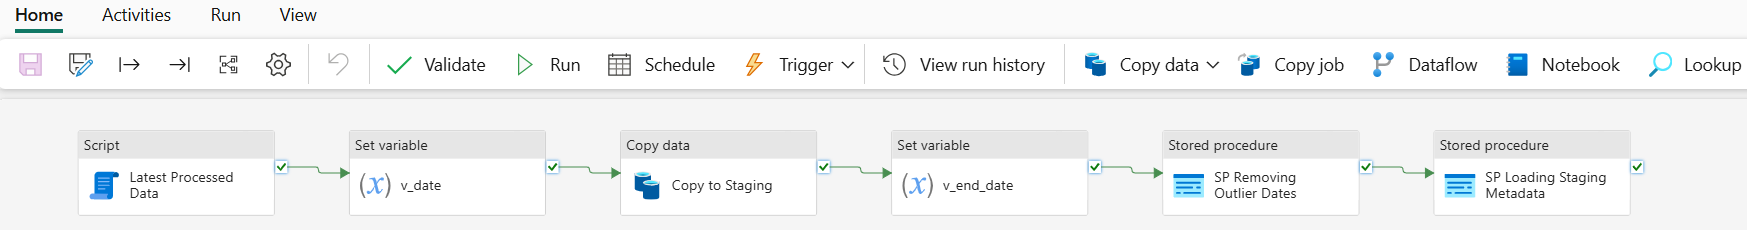
Overall pipeline
3. Presentation Layer
Create dbo.nyctaxi_yellow table to store the data for the presentation layer.
Go to warehouse and run this SQL query.
1
2
3
4
5
6
7
8
9
10
11
12
13
14
CREATE TABLE dbo.nyctaxi_yellow
(
	vendor varchar(50),
	tpep_pickup_datetime date,
	tpep_dropoff_datetime date,
	pu_borough varchar(100),
	pu_zone varchar(100),
	do_borough varchar(100),
	do_zone varchar(100),
	payment_method varchar(50),
	passenger_count int,
	trip_distance FLOAT,
	total_amount FLOAT
);
Note: the columns are taken by referring to an individual month’s trip data file, taxi zone lookup file and data dictionary.
This table’s columns should match the output of the data flow that we are going to create. The data flow includes cleaning and transformation (merging with taxi_zone_lookup) to get the required output for the presentation layer.
Dataflow: df_pres_processing_nyctaxi
In this Dataflow, the focus is on cleaning, enriching, and standardizing the raw trip data before loading it into the presentation table dbo.nyctaxi_yellow.
Key Steps Performed:
- Source Connection
- Connected to the Warehouse and retrieved the
stg.nyctaxi_yellowtable.
- Connected to the Warehouse and retrieved the
- Data Cleaning
- Removed unused cost-related columns such as fare details, surcharge amounts, and congestion fees.
- Vendor & Payment Method Mapping
- Converted numeric
VendorIDvalues into meaningful vendor names. - Translated
payment_typecodes into human-readable payment method labels. - The conversion is based on the info from the data dictionary.
- Dropped technical IDs that were no longer needed after enrichment.
- Converted numeric
- Date & Type Standardization
- Extracted only the date component from pickup and drop-off timestamps.
- Ensured consistent data types for categorical fields like vendor and payment method.
- Location Enrichment
- Joined the dataset with the Taxi Zone Lookup table twice:
- Once for pickup location, generating
pu_boroughandpu_zone. - Once for drop-off location, generating
do_boroughanddo_zone.
- Once for pickup location, generating
- Removed the original location ID fields after enrichment.
- Joined the dataset with the Taxi Zone Lookup table twice:
- Final Structuring
- Reordered and renamed columns for clarity and standardization.
- Produced a clean, enriched dataset.
Here’s a snapshot of the final table after all the transformations.
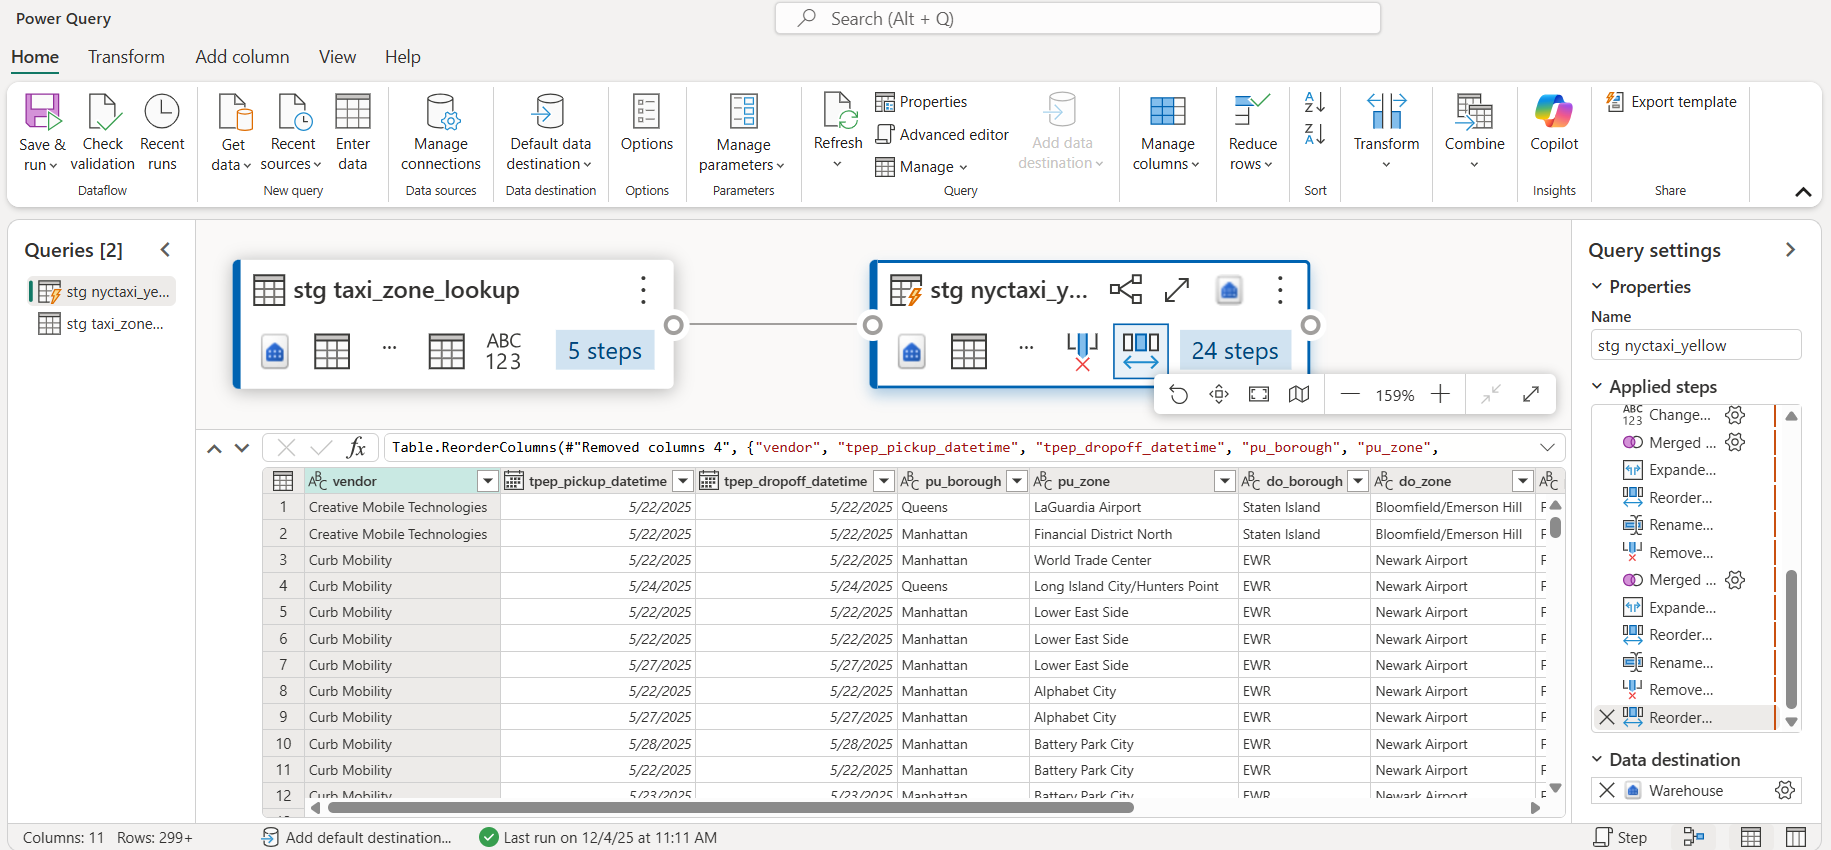
We now create a data destination in the Dataflow. The data destination will be the table that we just created for our presentation layer, i.e. dbo.nyctaxi_yellow. Choose append option in the settings.
Run the Dataflow and verify that the data is loaded into the destination table.
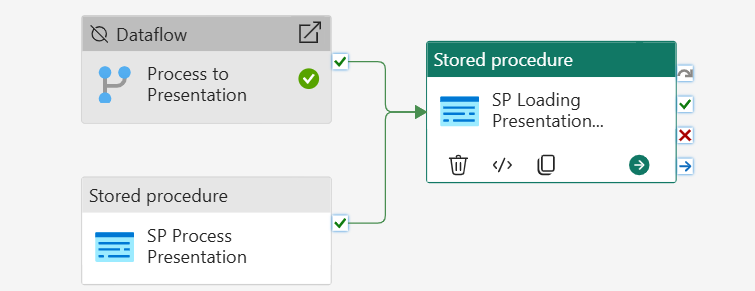
Pipeline 3: pl_pres_processing_nyctaxi
Create the third pipeline and add our Dataflow that we just created.
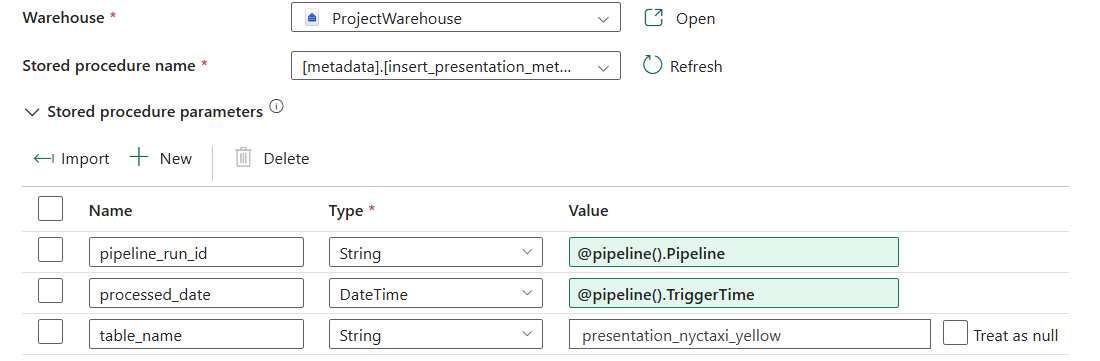
Now, in order to add metadata of this pipeline run, we create the Stored Procedure as shown below, and add this Stored Procedure Activity to the pipeline.
1
2
3
4
5
6
7
8
9
10
11
12
13
CREATE PROCEDURE metadata.insert_presentation_metadata
    @pipeline_run_id VARCHAR(255),
    @table_name VARCHAR(255),
    @processed_date DATETIME2
AS
    INSERT INTO metadata.processing_log (pipeline_run_id, table_processed, rows_processed, latest_processed_pickup, processed_datetime)
    SELECT
        @pipeline_run_id AS pipeline_id,
        @table_name AS table_processed,
        COUNT(*) AS rows_processed,
        MAX(tpep_pickup_datetime) AS latest_processed_pickup,
        @processed_date AS processed_datetime
    FROM dbo.nyctaxi_yellow;
This is same as the staging metadata, only change being that the data is now queried from the table dbo.nyctaxi_yellow.
Instead of the Dataflow, we can also create the Stored Procedure to implement the data cleaning and transformation steps. Stored Procedure is more efficient that the Dataflow especially with large datasets.
Stored Procedure: dbo.process_presentation
In the warehouse, run this SQL query to create the stored procedure.
1
2
3
4
5
6
7
8
9
10
11
12
13
14
15
16
17
18
19
20
21
22
23
24
25
26
27
28
29
30
31
32
33
34
35
CREATE PROCEDURE dbo.process_presentation
AS
INSERT INTO dbo.nyctaxi_yellow
    SELECT
    CASE
        WHEN nty.VendorID = 1 THEN 'Creative Mobile Technologies'
        WHEN nty.VendorID = 2 THEN 'Curb Mobility'
        WHEN nty.VendorID = 6 THEN 'Myle Technologies'
        WHEN nty.VendorID = 7 THEN 'Helix'
        else 'Unknown'
    end as vendor,
    format(nty.tpep_pickup_datetime,'yyyy-MM-dd') as tpep_pickup_datetime,
    format(nty.tpep_dropoff_datetime,'yyyy-MM-dd') as tpep_dropoff_datetime,
    lu1.Borough as pu_borough,
    lu1.Zone as pu_zone,
    lu2.Borough as pu_borough,
    lu2.Zone as pu_zone,
    CASE
        WHEN nty.payment_type = 0 THEN 'Flex Fare trip'
        WHEN nty.payment_type = 1 THEN 'Credit card'
        WHEN nty.payment_type = 2 THEN 'Cash'
        WHEN nty.payment_type = 3 THEN 'No charge'
        WHEN nty.payment_type = 4 THEN 'Dispute'
        WHEN nty.payment_type = 5 THEN 'Unknown'
        WHEN nty.payment_type = 6 THEN 'Voided trip'
        else ''
    end as payment_method,
    nty.passenger_count as passenger_count,
    nty.trip_distance as trip_distance,
    nty.total_amount as total_amount
    from stg.nyctaxi_yellow nty
    left join stg.taxi_zone_lookup lu1
    on nty.PULocationID = lu1.LocationID
    left join stg.taxi_zone_lookup lu2
    on nty.DOLocationID = lu2.LocationID;
We can now add this as Stored Procedure activity into the pipeline and deactivate the Dataflow.
Pipeline 4: pl_orchestrate_nyctaxi
This pipeline is used to combine the two pipelines that we created earlier. Fabric has the functionality to use pipelines into other pipelines.
Use the Invoke Pipeline activity twice as shown below. It runs the staging and presentation pipelines.
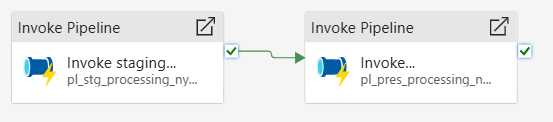
Run this pipeline to process the monthly data. Each run will process one month of data. Since first month is processed, we need to run this pipeline 9 more times.
4. Reporting Layer
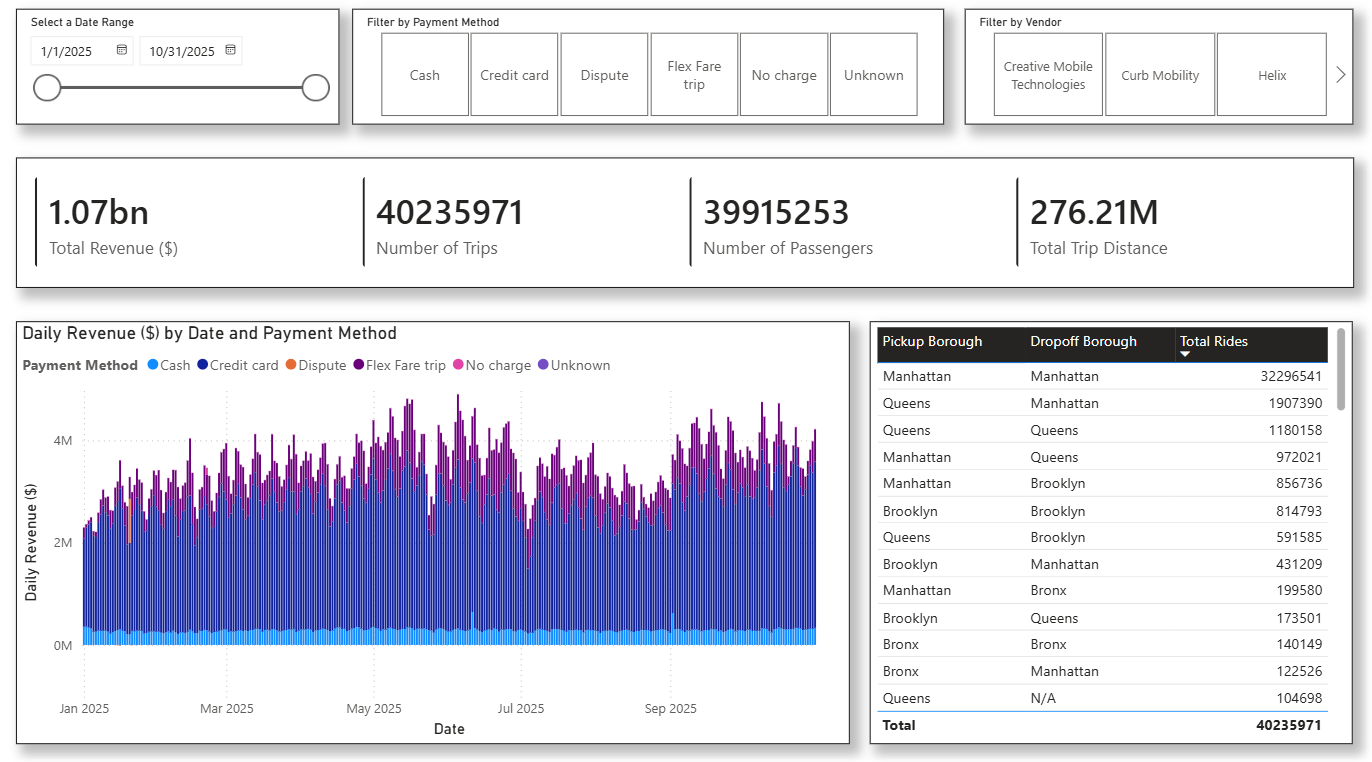
In this layer, we use the data in the presentation layer to create the semantic model and use the semantic model to create a Power BI report.
In the warehouse, at the top ribbon, click on New semantic model and select the dbo.nyctaxi_yellow table.
Create new report in the workspace by selecting the created semantic model.
This is the final Power BI report: