Global Superstore Sales Dashboard
Introduction
The goal of this project is to create a comprehensive dashboard that provides insights into the sales performance of a global superstore. By analyzing various aspects such as regional, market, country, ship mode and time-based trends, the dashboard aims to assist in making data-driven business decisions.
Objective
- To visualize and analyze the sales data of a global superstore.
- To explore trends and patterns across different aspects like category, country, market, regions.
- To provide actionable insights that can drive business strategy.
Data Source
The dataset used for this project was sourced from Kaggle. It includes detailed sales records for a global retail superstore, covering various regions, countries, cities, categories, and time periods.
Key Features
- Dynamic Filtering: Users can filter data by year, quarter, market, region, segment, country, and city.
- Interactive Visuals: Various charts and graphs that make the data easy to understand.
- Bookmarks: Used to open slicer panel for filtering data, providing a seamless user experience.
Dashboard Highlights
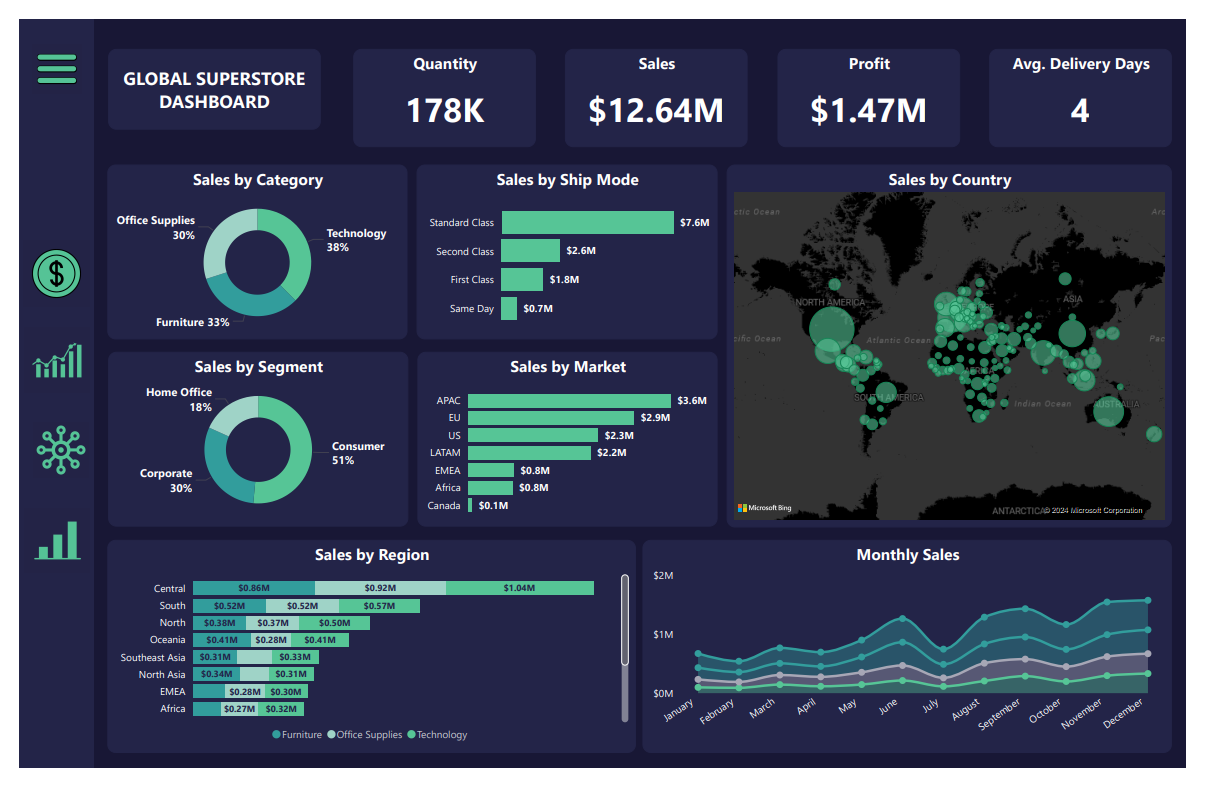
✅ Sales Dashboard: Sales trends based on different parameters like Category, Ship Mode, Segment, Country, Region, Market etc.
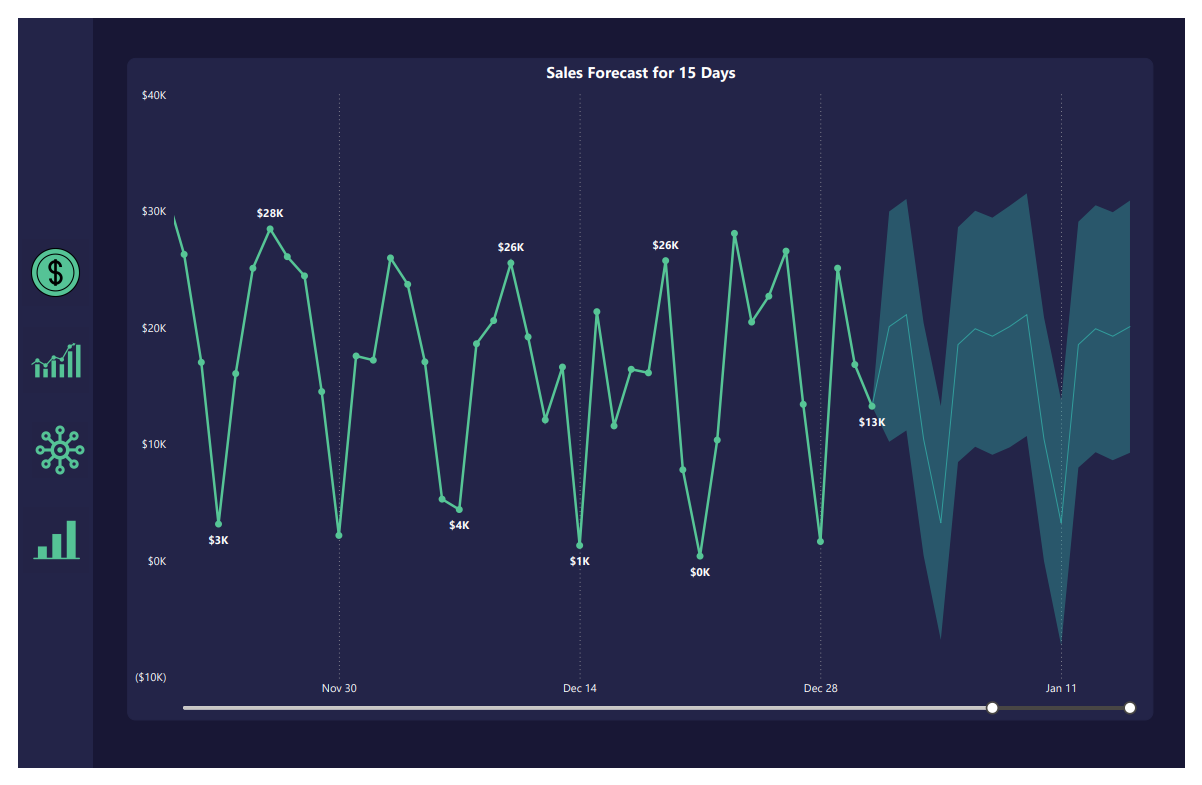
✅ Forecast: Sales forecast for the next 15 days
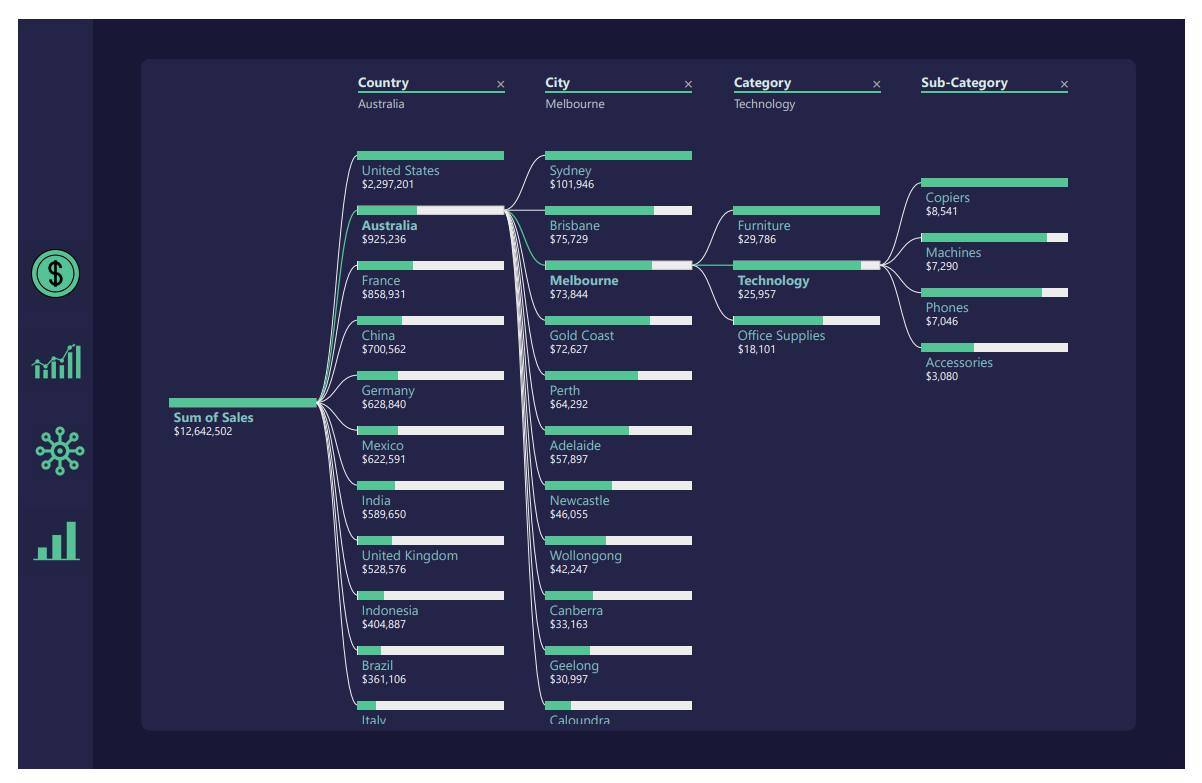
✅ Decomposition chart: To show the sales distribution by Country, City, Category, Sub-category
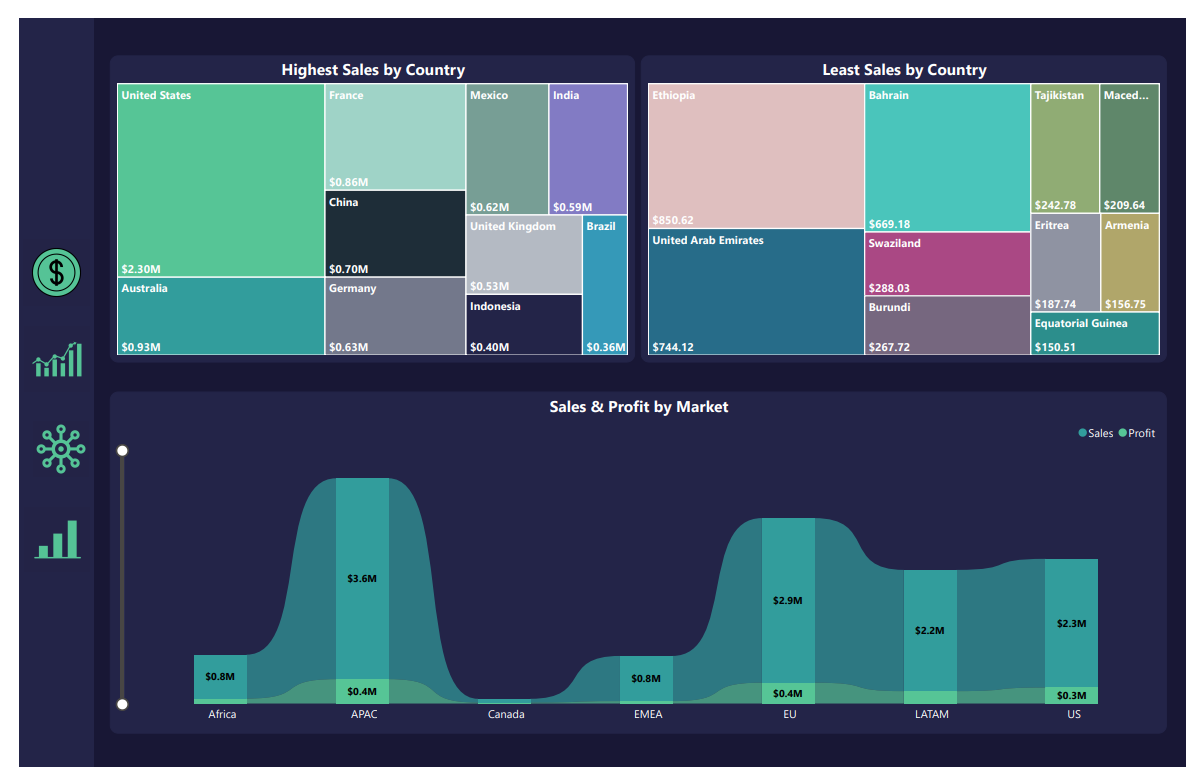
✅ Sales comparison: To show the countries with highest and lowest sales, sales and profits by Market and year.
Power BI Dashboard
Conclusion
This project was a valuable learning experience that helped me deepen my understanding of data visualization. By focusing on the business context before diving into the technical aspects, I was able to deliver a dashboard that is not only visually appealing but also meaningful and actionable.