Furniture Pro & Co., Retailers - Power BI Case Study
Project Overview
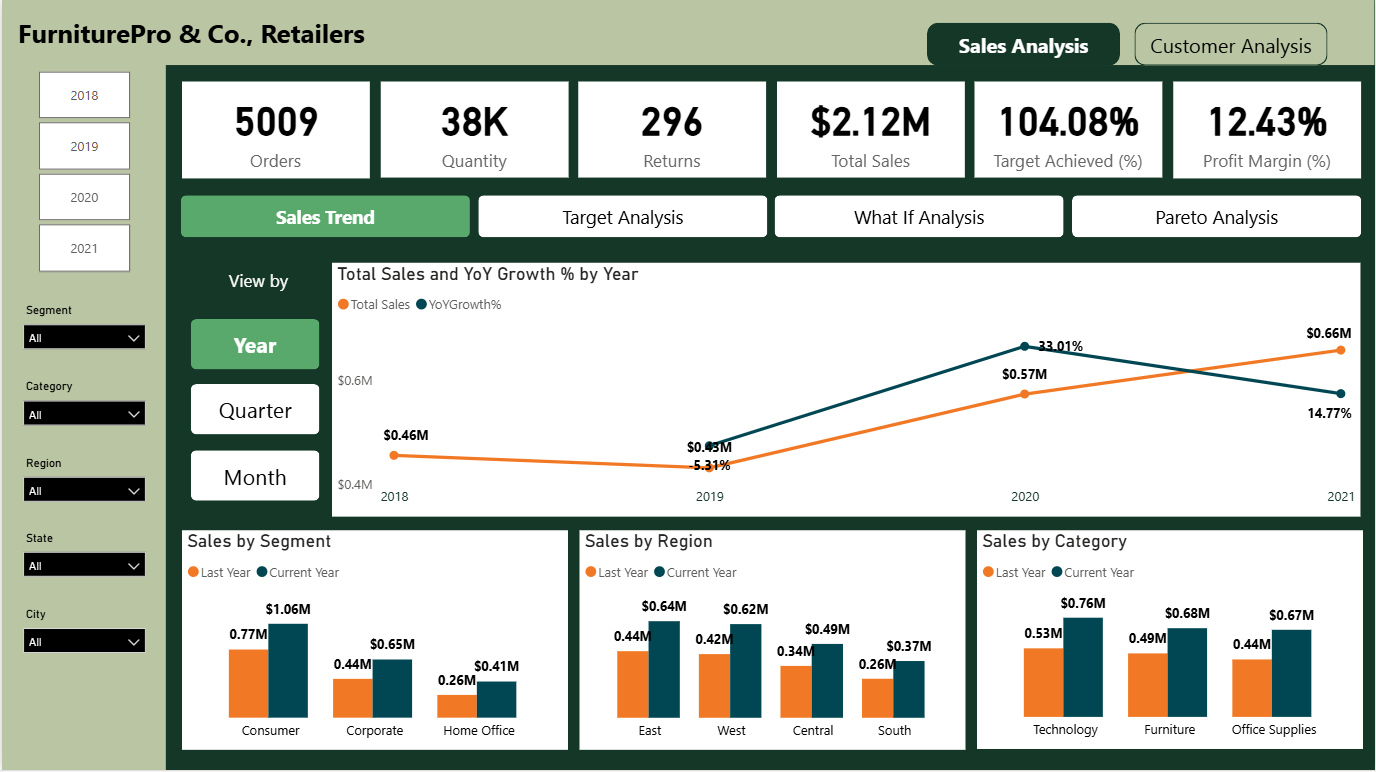
This Power BI project delivers actionable insights for Furniture Pro and Co. Retailers by analyzing sales performance and customer behavior. The dashboard is designed to help business leaders understand trends, identify high-value customers, and optimize sales strategies using advanced analytics and interactive visuals.
Objectives
- Analyze sales performance across regions, segments, and categories.
- Identify sales trends, growth opportunities, and areas for improvement.
- Segment customers using RFM (Recency, Frequency, Monetary value) analysis.
- Highlight top-performing salespersons and customer segments.
- Enable scenario analysis with What-If and Pareto Analysis.
Data Preparation
- Data Cleaning & Transformation: Utilized Power Query to clean, transform, and join multiple datasets.
- Handling Missing Data: Addressed inconsistencies and missing values to ensure accurate analysis.
- KPI Calculation: Created DAX formulas and what-if parameters to support the analysis.
Report Pages
- Sales Analysis
- Trends: Monthly and quarterly sales trends, year-over-year growth.
- Comparisons: High/low performing regions, segments, and categories.
- Returns: Analysis of most returned products by category and region.
- What-If Analysis: Predict profit based on user-defined discount rates.
- Pareto Analysis: Identify what % of sales is contributed by top % of customers.
- Customer Analysis
- RFM Segmentation: Classify customers into low, medium, and high-value segments.
- Customer Segmentation: Visualize segment contributions to total sales.
- New Customer Analysis: Track new customers in 2021, their sales, quantity, and discounts.
- Top Salespersons: Identify top 5 salespersons per segment at state and city level, including their sales and average discounts.
Key Insights
Sales Growth: 2021 marked the highest annual sales, with over 60% of revenue coming from the East and West regions. The year 2020 showed a strong 33% YoY sales growth, driven by the consumer segment and consistently strong Q4 performance across all years.
Revenue Distribution: The top 20% of customers contributed over 49% of total sales, highlighting a Pareto trend and the need for focused customer retention and loyalty strategies.
Product Returns: Returns were predominantly high in the Office Supplies category and the West region, indicating potential issues with product quality or customer alignment that need to be addressed. Customer Segmentation: RFM analysis showed that high-value customers, while only 40% of the customer base, accounted for 65% of total revenue—making them a critical segment for targeted marketing and retention efforts.
New Customer Acquisition (2021): Only 11 new customers were acquired in 2021, contributing $7.36K in sales. This indicates a significant opportunity to improve marketing strategies and attract a broader customer base.