Call Centre Dashboard using Excel
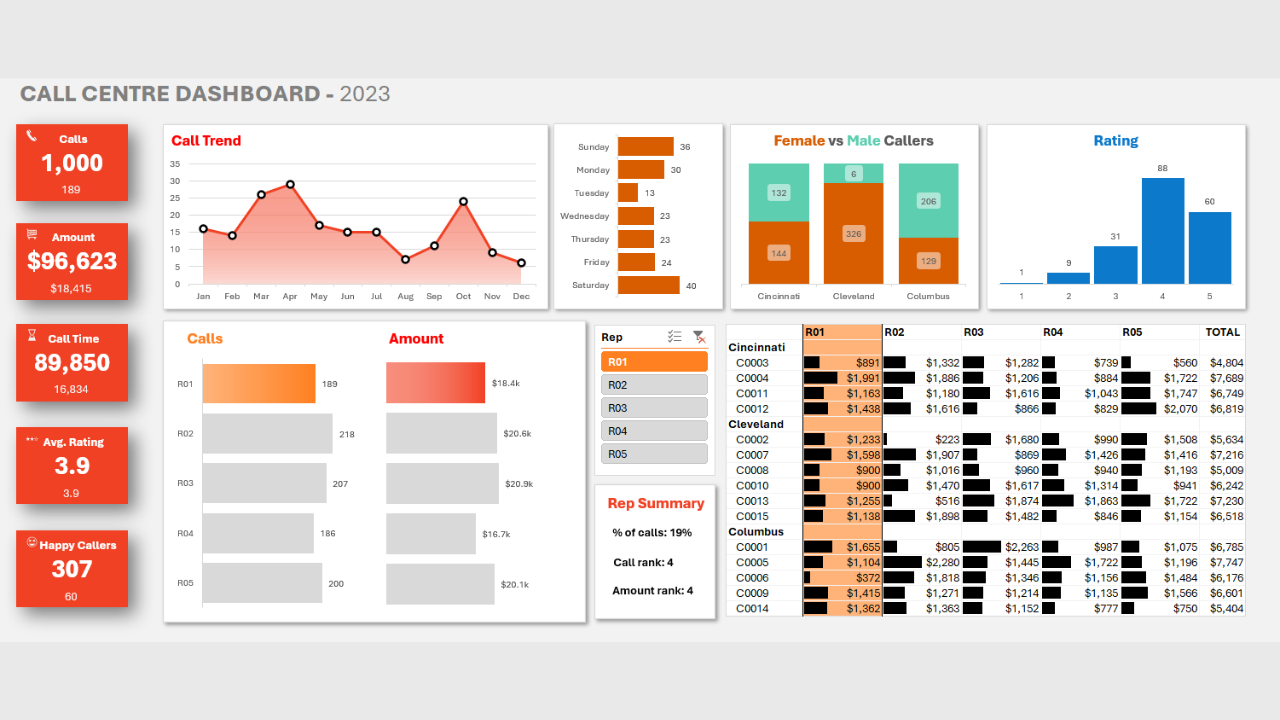
Designed an interactive Excel dashboard using pivot tables, charts, and slicers. Tracked key metrics like call time, volume, and amount. Improved visibility into performance trends. Strengthened my Excel visualization skills.
This post is licensed under CC BY 4.0 by the author.